Insights
Data-driven insights into housing in the Netherlands — safety, liveability, prices and the neighbourhood, from official sources.

Safest cities in the Netherlands (2025)
Which large cities have the least registered crime per 1,000 residents? A ranking based on police figures 2025 — with the caveats you should know.

Liveability per municipality: the highest Leefbaarometer scores
Which municipalities score highest on liveability according to the Leefbaarometer (2024)? A ranking of Dutch municipalities — and what the score does and doesn't say.
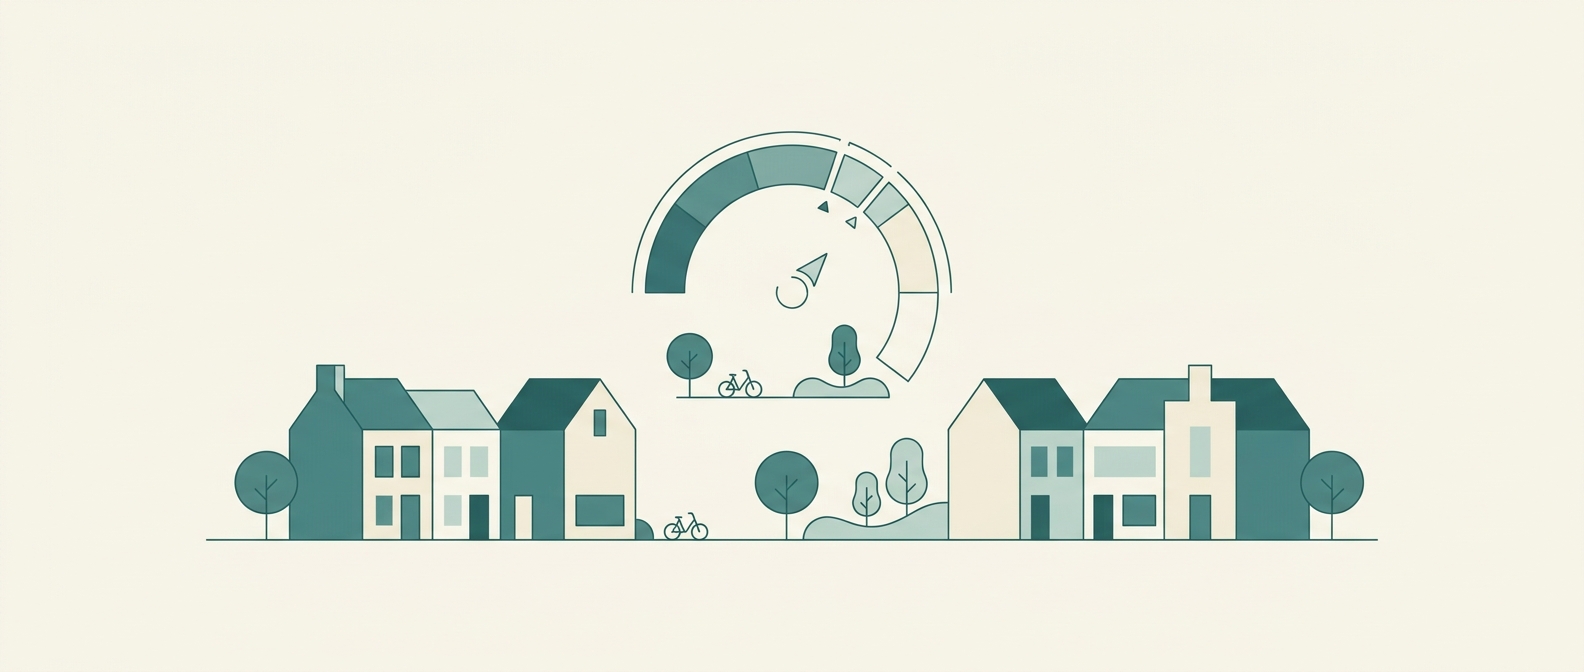
What is a good Leefbaarometer score?
The Leefbaarometer expresses liveability on a national scale — higher is more liveable. How to read the score, and the five dimensions beneath it.

Most expensive municipalities in the Netherlands by WOZ value
Which municipalities have the highest average WOZ value? A ranking based on CBS figures — and why WOZ is something other than the market price.

Best neighbourhood for a family: what to look for
Looking for a family-friendly neighbourhood? These are the six things that really matter — schools, safety, home type, green space and noise — and how to check them per address.
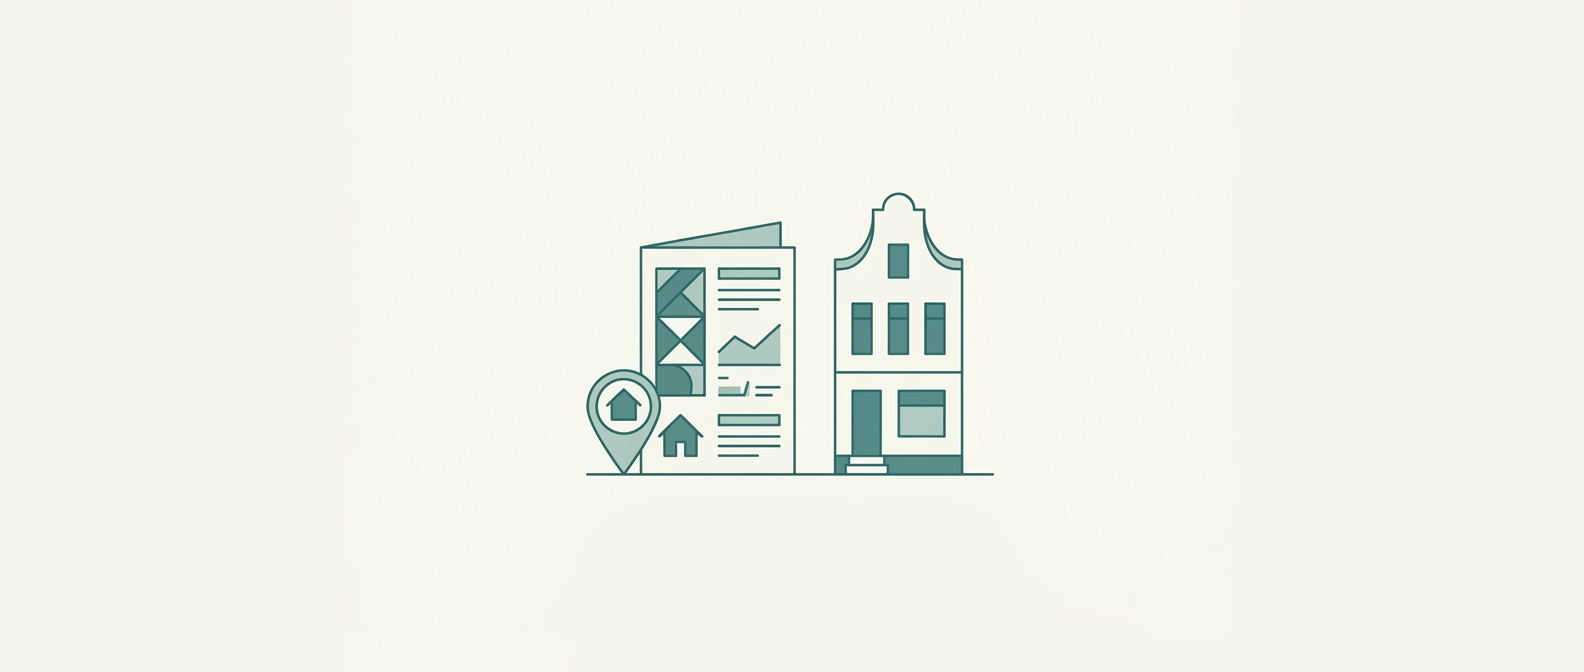
Buying a neighbourhood report: what you get, and what it costs
A neighbourhood report bundles public data (safety, liveability, energy label, schools, noise) per address into one overview. What's in it, what it costs, and when it's worth it.
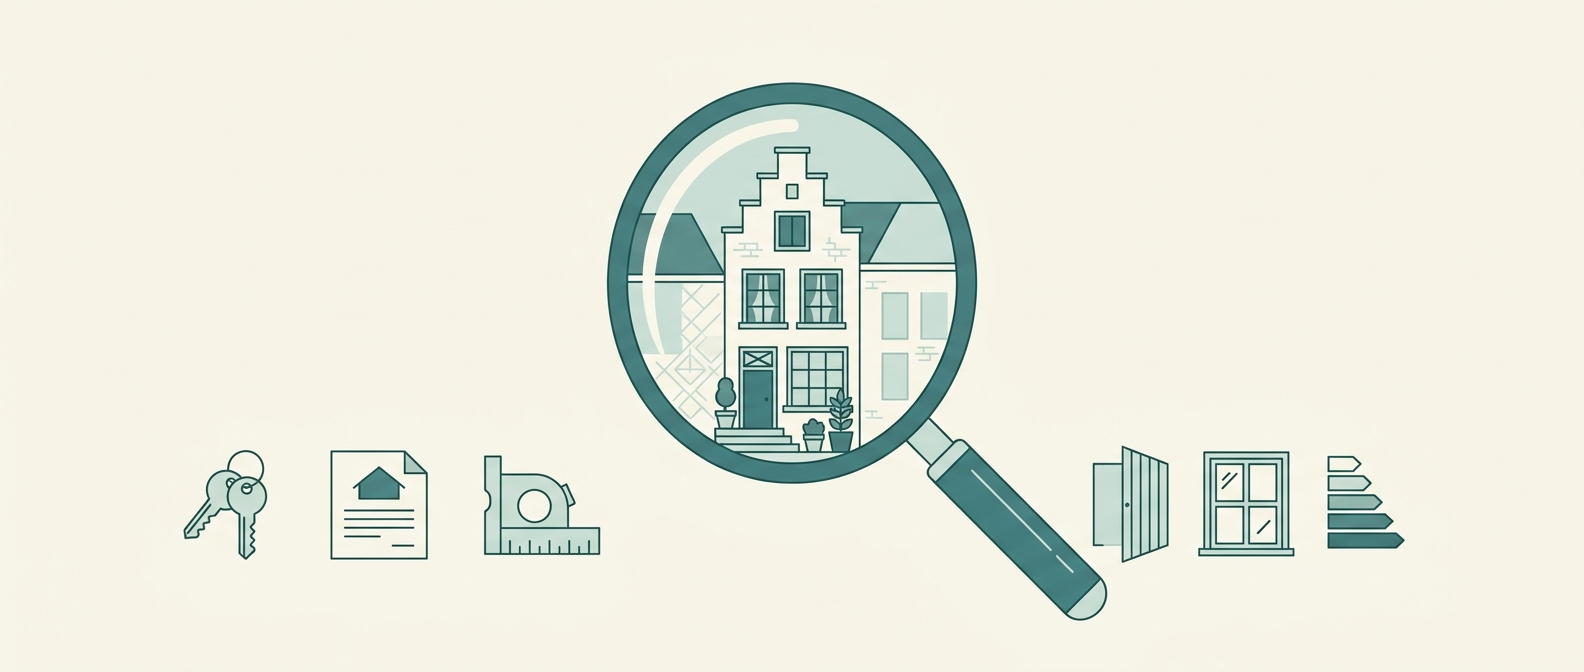
Checking a home before the viewing: how to do it
The photos say nothing about the neighbourhood. Before you go look, check five things — safety, liveability, noise, schools and the energy label — so you don't waste half a day on the wrong home.

Crime per neighbourhood: what the figures do and don't say
One total of crimes says little. What counts is the type of offence, the neighbourhood size and the context. How to read police figures per neighbourhood without scaring yourself needlessly.

An alternative to neighbourhood and home reports: what to look for
Neighbourhood reports largely use the same public data. The difference is in interpretation, honesty and whether the report helps you at the viewing. What to watch when choosing.