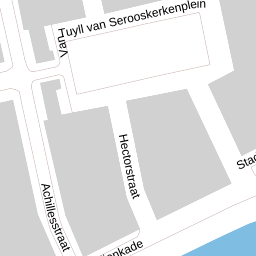
Achillesstraat 114, Amsterdam
Densely populated urban neighborhood with high bicycle theft and property crime; suitable for starters and internationals, less suitable for quiet living
Overall verdictFits best with City lifestyle, Expat / international, Starter
Excellent accessibility to schools (0.4 km), supermarket (0.2 km) and general practitioner (0.7 km). Wide range of schools within 2 km radius. Energy class D with low CO₂ emissions. Many households and vibrant urban life.
Bicycle theft dominant (58 cases annually). High overall property crime (22 other property offenses, 13 theft from/off vehicles). Very high population density (20,751 inh/km²) and 70% rental housing indicate a transient, busy neighborhood. Liveability index shows slight insecurity (-0.056), but social cohesion weak (-0.102). Air quality moderate (NO₂ 18.3 µg/m³, PM2.5 9.4 µg/m³).
- Short distance to school (0.4 km) and supermarket (0.2 km)
- 24 schools within 2 km radius
- Energy class D, low CO₂ footprint (49 kg/year)
- Low noise exposure (50 dB Lden)
- Many sports and recreation opportunities in the neighborhood
Is this address right for you?
Perfect for city living: excellent access to schools/shops, many amenities, sports opportunities, a vibrant public and international orientation. Property crime is part of the urban experience.
Very urban, diverse population, much international public, good accessibility. High transience (70% rental) and international schools present fit well.
Central, excellent access to facilities, many starters in the neighborhood (very transient). Rental market stronger than purchase (29% owner-occupied). Lower floor area (73 m²) and energy costs more favorable.
Average WOZ valuation €592k shows solid value, but very high property crime and low social stability pose a risk for resale and value growth.
Schools nearby with plenty of choice, but a very busy, transient neighborhood with significant property crime and low social cohesion. Not ideal for family stability.
Very high population density (20,751 inh/km²), much crime, transient public (70% rental) and weak neighborhood cohesion. Not a quiet environment.
Questions for the agent
Facts about the home
Energy label & consumption
Energy class D with calculated energy consumption 267 kWh/year and CO₂ emissions 49 kg/year. Apartment from 1930. Label valid until 2034.
Housing & population in Van Tuyllbuurt
Very high population density of 20,751 inh/km². Van Tuyllbuurt has 4,140 residents. 70% rental housing, only 1% single-family homes; mainly multi-family (99%). 1,190 one-person households underscore transience.
This neighbourhood on the scale of the Netherlands
National reference: CBS / Police, 2024.
Liveability Monitor 3.0 · 2024 measurement
Liveability index 4.31 (neutral-positive). Insecurity score -0.056 (very low perception). Social cohesion however weak (-0.102). Housing quality slightly negative (-0.033) due to density.
Registered crimes · 2025
Bicycle theft dominates with 58 cases annually in this neighborhood, followed by other property offenses (22) and theft from vehicles (13). Total 181 crime incidents per year.
Air, noise, greenery & climate
Low noise exposure (50 dB Lden). Limited green space (11% trees, 35% green/blue within 500m). NO₂ 18.3 µg/m³, PM2.5 9.4 µg/m³. Heat-island effect 1.9°C. Hazardous substances present within 1 km.
Primary schools within 2 km
Asking price versus the neighbourhood
Average WOZ in this neighborhood €592,000. No current asking price available.
What does this cost per month?
Viewing checklist
Sources & resolution
Per-address data comes only from PDOK (BAG + Location server) and EP-Online. All other figures apply to the neighbourhood or municipality. That's why we say “in this neighbourhood”, never “this house”. Addresses are linked by PDOK to the nearest existing address.